SSIS - How to Use Data Viewer
Scenario:
Lets say we are developing a package and it extracts some records from source,Implement some business logic by using different transformations and finally load into destination(table/file). When we look at destination, record is incorrect but we are not sure what happen to source record. we want to see the change in record/records after each of transformation to find out which logic is not working correctly.Solution:
SQL Server Integration Services ( SSIS) provided Data Viewer in Data Flow Task. Data Viewer can be used between two transformations to see the data. When we executes our package Data Viewer pop up window shows data so we can see What is changed from Input to Output.In this example we are extracting few records from Source, We want to see what are we extracting.We have used aggregate transformation that is grouping by CountryName and Doing Sum operation on SaleAmount. We can create second data viewer after Aggregate transforamtion to see the data.
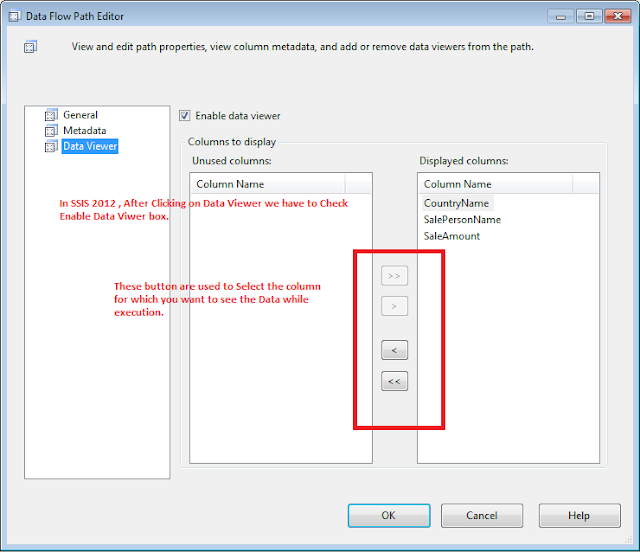
To use Data Viewer between Tranforamtions, Double click on green connection that exits between two transformations, It will open Data Viwer Editor( Data Flow Path Editor).
There are three options on Left Pane
General: Provides general information
MetaData : Provided meta data information of columns
Data Viewer: This is the tab where we will be able to select the column those we want to include in Data View.
In SSIS 2008/ R2 and previous versions where were other options available in Data View. Those options are removed and only Grid option is left in SSIS 2012 and that is even not called Grid anymore but only Data Viewer.
SSIS 2012 Data View Editor
Once data viewers are created, we can execute our package. We will be able to see data at different stages of execution.
We can hit Play button in Data Viwer Output window to go to next Data Viewer. The data can also be copied from Data Viewer and used for testing.


No comments:
Post a Comment